Analyzing my Fitbit data. Step 2 - Cleaning step and sleep data and looking for trends
This post documents cleaning of my Fitbit daily step and sleep data and also a simple approach to looking for trends in the data. This is a continuation of my last post on this blog.
Approach
First of all, please check my last post Analyzing my Fitbit data. Step 1 - Downloading Fitbit data via the API, if you haven’t read it yet.
The code for the present post is once more compiled and explained with many in-line comments in a Jupyter notebook using the Python 3 kernel. Thus I will not reiterate the analysis steps here. In brief, the notebook describes how I cleaned my step data by removing outliers and how I used detailed sleep log data to compute the number of minutes I slept each day.
I do, however, want to share the two final plots created in the analysis showing the rolling mean of my daily step and sleep data between end of January and end of March 2016:
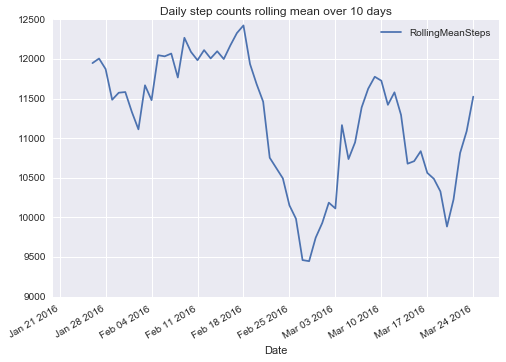
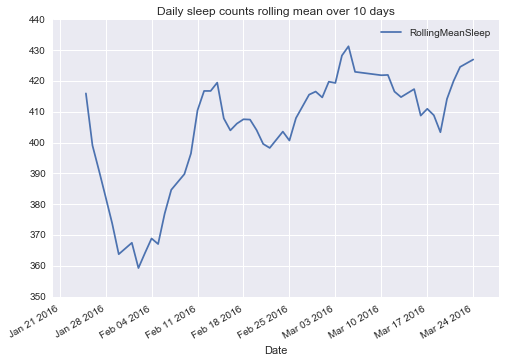
As described in the Jupyter notebook, sleep counts are measured in minutes.
Next steps
Before drawing conclusions about potential correlations between my daily step and sleep data, I would like to gather additional data over the next months and then return to this analysis. The reason is that I do not think that I can draw valuable conclusions from only two months of data right now. I came to realize this while performing the analyses described in this post.
Once I collected more data, I would furthermore like to investigate whether my activity and sleep patterns depend on the day of the week.


